|
|
4 years ago | |
|---|---|---|
| .. | ||
| audit | 4 years ago | |
| README.md | 4 years ago | |
| mem.gif | 4 years ago | |
| network.gif | 4 years ago | |
| system.gif | 4 years ago | |
README.md
System Monitor
Objectives
The objective for this project is to show that you have acquired programming logic and that you are able to adapt to new languages.
The programming language you are about to use is C++. Creating a project from scratch will not be asked, instead you will have to add features or fix the code of a given application.
The application you are about to work on is a Desktop System Monitor. The app will monitor the computer system resources and performance, such as CPU, RAM, SWAP, Fan, Network and more. For the GUI you will use the Dear ImGui library for C++.
Instructions
Dear ImGui
As stated above the GUI you are going to use is Dear ImGui there are some notions you should know about this library/API.
The first important point to be aware of is that ImGui is an immediate mode graphic user interface, as the name implies it: "ImGui". There are two types of UIs, retained mode and immediate mode.
-
Immediate mode: the application state is separated from the graphics library. It is the application responsibility for drawing commands when necessary. In other words, in immediate mode the client calls directly results in the rendering of graphics objects to the display.
-
Retained mode: the client calls do not directly cause actual rendering, but instead update an abstract internal model, which is maintained within the library's data space. You can see more about this mode here.
For this API there is no need for specific builds, you can add the files to your existing project.
To integrate Dear ImGui you must use a backend, this backend passes mouse/keyboard/gamepad inputs and a variety of settings. It is
in charge of rendering the resulting vertices.
The backend will be provided by us, in a file system described in the next paragraph.
You will have to install sdl by running the command apt install libsdl2-dev.
File System
The file system provided, here, will contain all the ImGui IPA. For easier understanding, see below a representation of the fs.
$ tree system-monitor
├── header.h
├── imgui                                 // <-- ImGui APIs
│   └── lib
│       ├── backend                       // <-- ImGui backend
│       │   ├── imgui_impl_opengl3.cpp
│       │   ├── imgui_impl_opengl3.h
│       │   ├── imgui_impl_sdl.cpp
│       │   └── imgui_impl_sdl.h
│       ├── gl3w
│       │   └── GL
│       │       ├── gl3w.c
│       │       ├── gl3w.h
│       │       └── glcorearb.h
│       ├── imconfig.h
│       ├── imgui.cpp
│       ├── imgui_demo.cpp
│       ├── imgui_draw.cpp
│       ├── imgui.h
│       ├── imgui_internal.h
│       ├── imgui_tables.cpp
│       ├── imgui_widgets.cpp
│       ├── imstb_rectpack.h
│       ├── imstb_textedit.h
│       └── imstb_truetype.h
├── main.cpp                             // <-- main file, where the application will
├── Makefile                             //     render (main loop)
├── mem.cpp                              // <-- memory resources and processes information
├── network.cpp                          // <-- network resources
└── system.cpp                           // <-- all system resources

5 directories, 28 files
Linux and Proc
To monitor the computer system resources and performance you will have to use the /proc filesystem.
The /proc filesystem is a virtual system that does not exist on disk. This system is created by the kernel when the system boots, and destroyed by it when the system shuts down.
This filesystem contains information about the system, from the CPU, to memory, to active processes and much more. For this reason, it can be regarded as a control and information center for the kernel. As a matter of fact, a lot of the system utilities are simple calls to files in this directory.
You can acquire more knowledge about this filesystem by taking a look to the proc manual page (man proc).
Monitorization
For this project you must present the following monitorization:
-
System monitor, that will contain :
-
The type of OS (Operating System).
-
The user logged into the computer.
-
The computer name, this being the hostname.
-
The total number of tasks/processes that are currently running, sleeping, uninterruptible, zombie, traced/stopped or interrupted.
-
Type of CPU
-
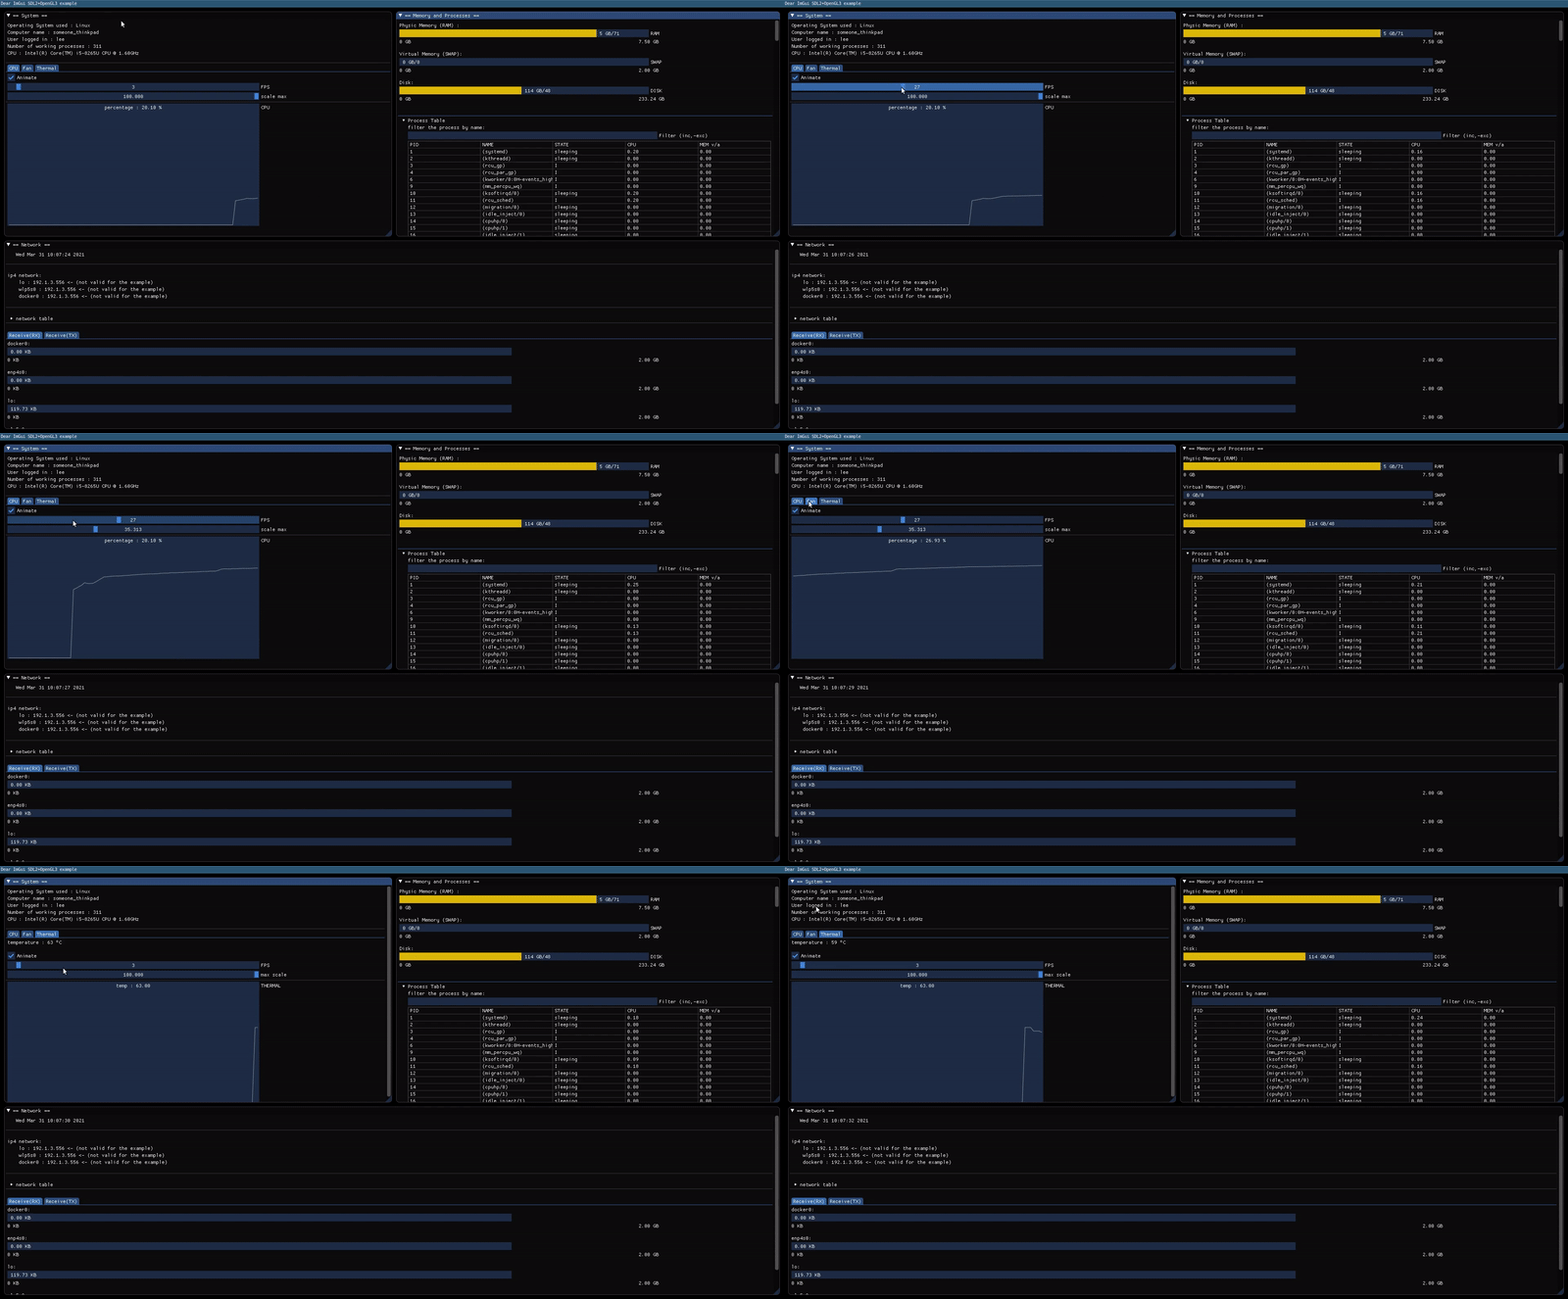
A tabbed section containing
CPU,Power,FanandThermalinformation, this information include a performance graphic for all those topics. This graph should contain some kind of checkbox or button to be able to stop the animation whenever the user desires to do so. Additionally, it should also have two slider bars. The first slider bar should be able to control theFPSof the graph, and the second slider bar should control theyscale of the graph.-
CPUshould present this graph with an overlay text saying the current percentage of the CPU. -
Fan, should include the following information, the status of the fan, (enable/active), the current speed and the level. And should also present the graph stated above. -
Thermal, should present the graph stated above with an overlay text saying the current temperature of the computer (usually the cpu sensor).
example :
-
-
-
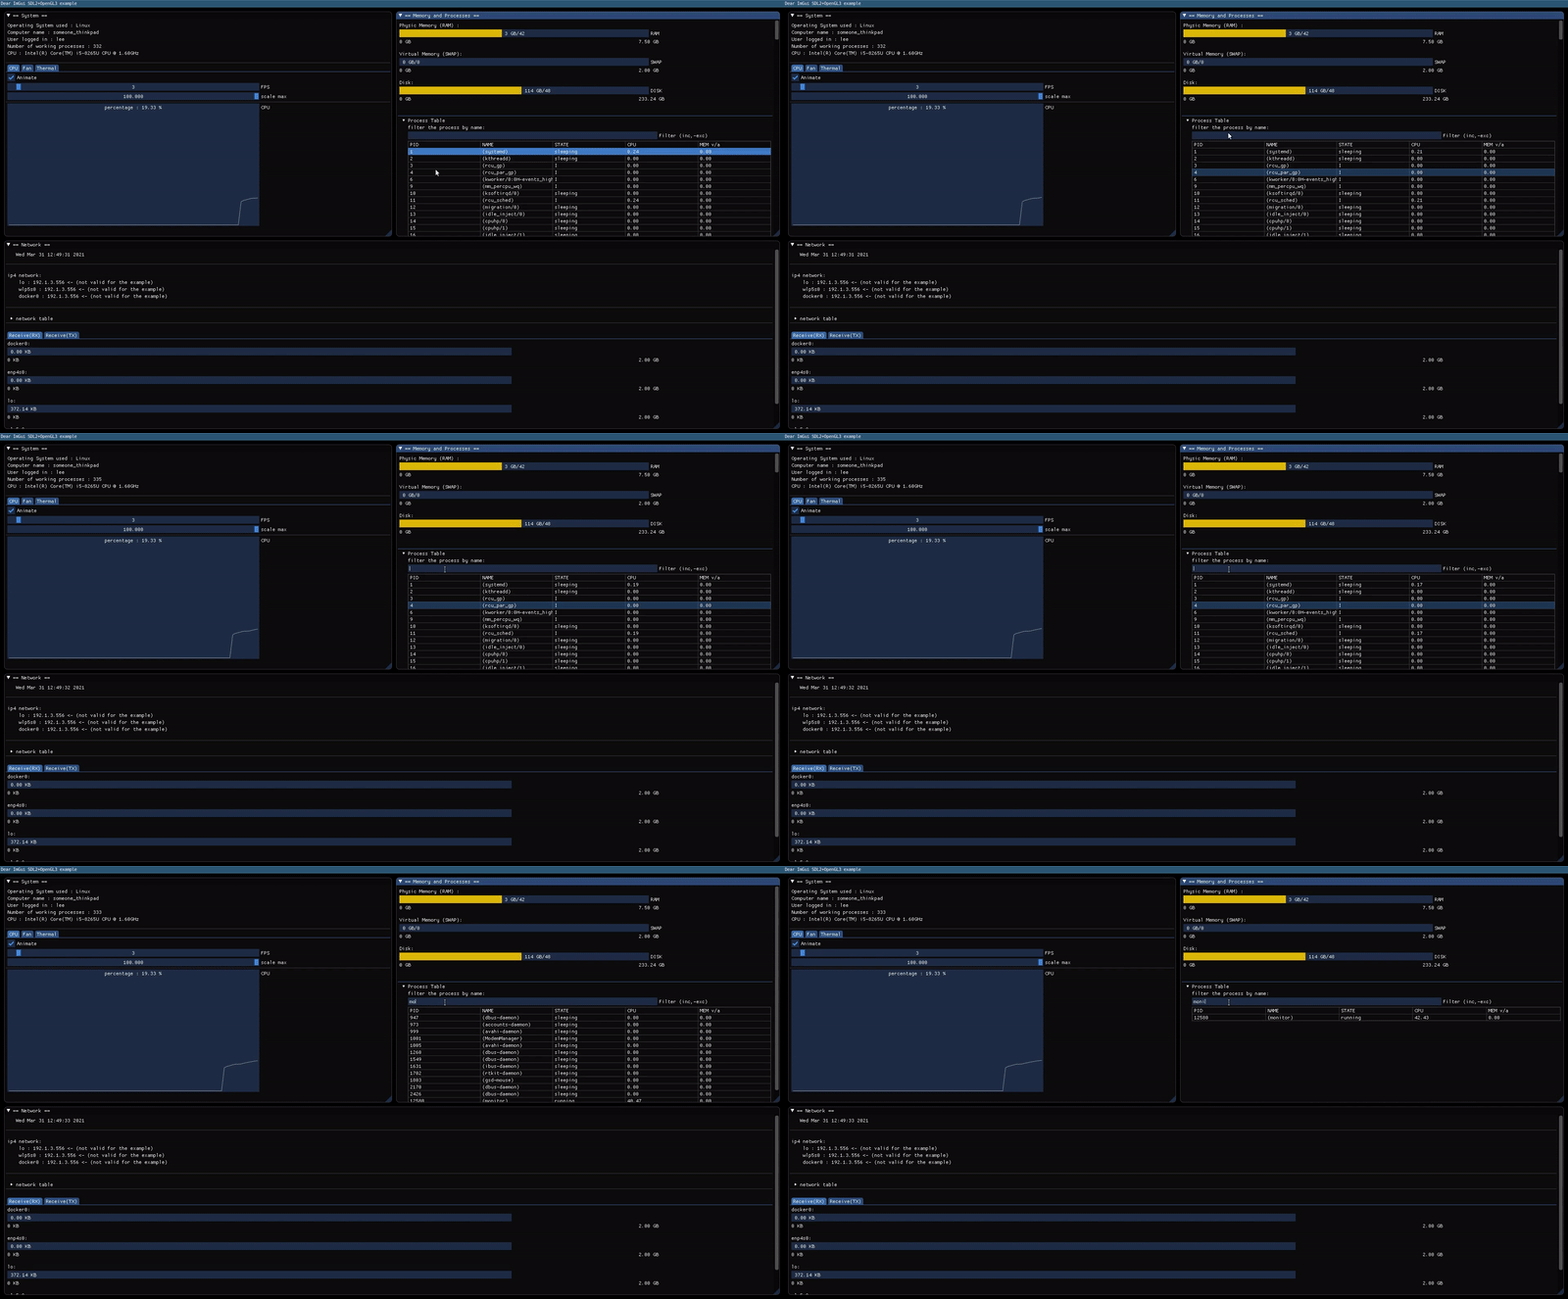
Memory and process monitor, that will contain :
-
The Physic Memory (RAM) being used, it must have some kind of visual display of this usage.
-
The Virtual Memory (SWAP) being used, it should also include a visual display.
-
The Disk usage, same here.
-
A tab bar that should contain a table of processes with the following columns :
- PID, with the process identification.
- Name, name of the process.
- State, current state of the process.
- CPU usage, how much CPU the process is using in percentage.
- Memory usage, how much memory the process is using in percentage.
-
A text box that lets the user filter the table. Users must be able to select multiple rows of the table.
example :
-
-
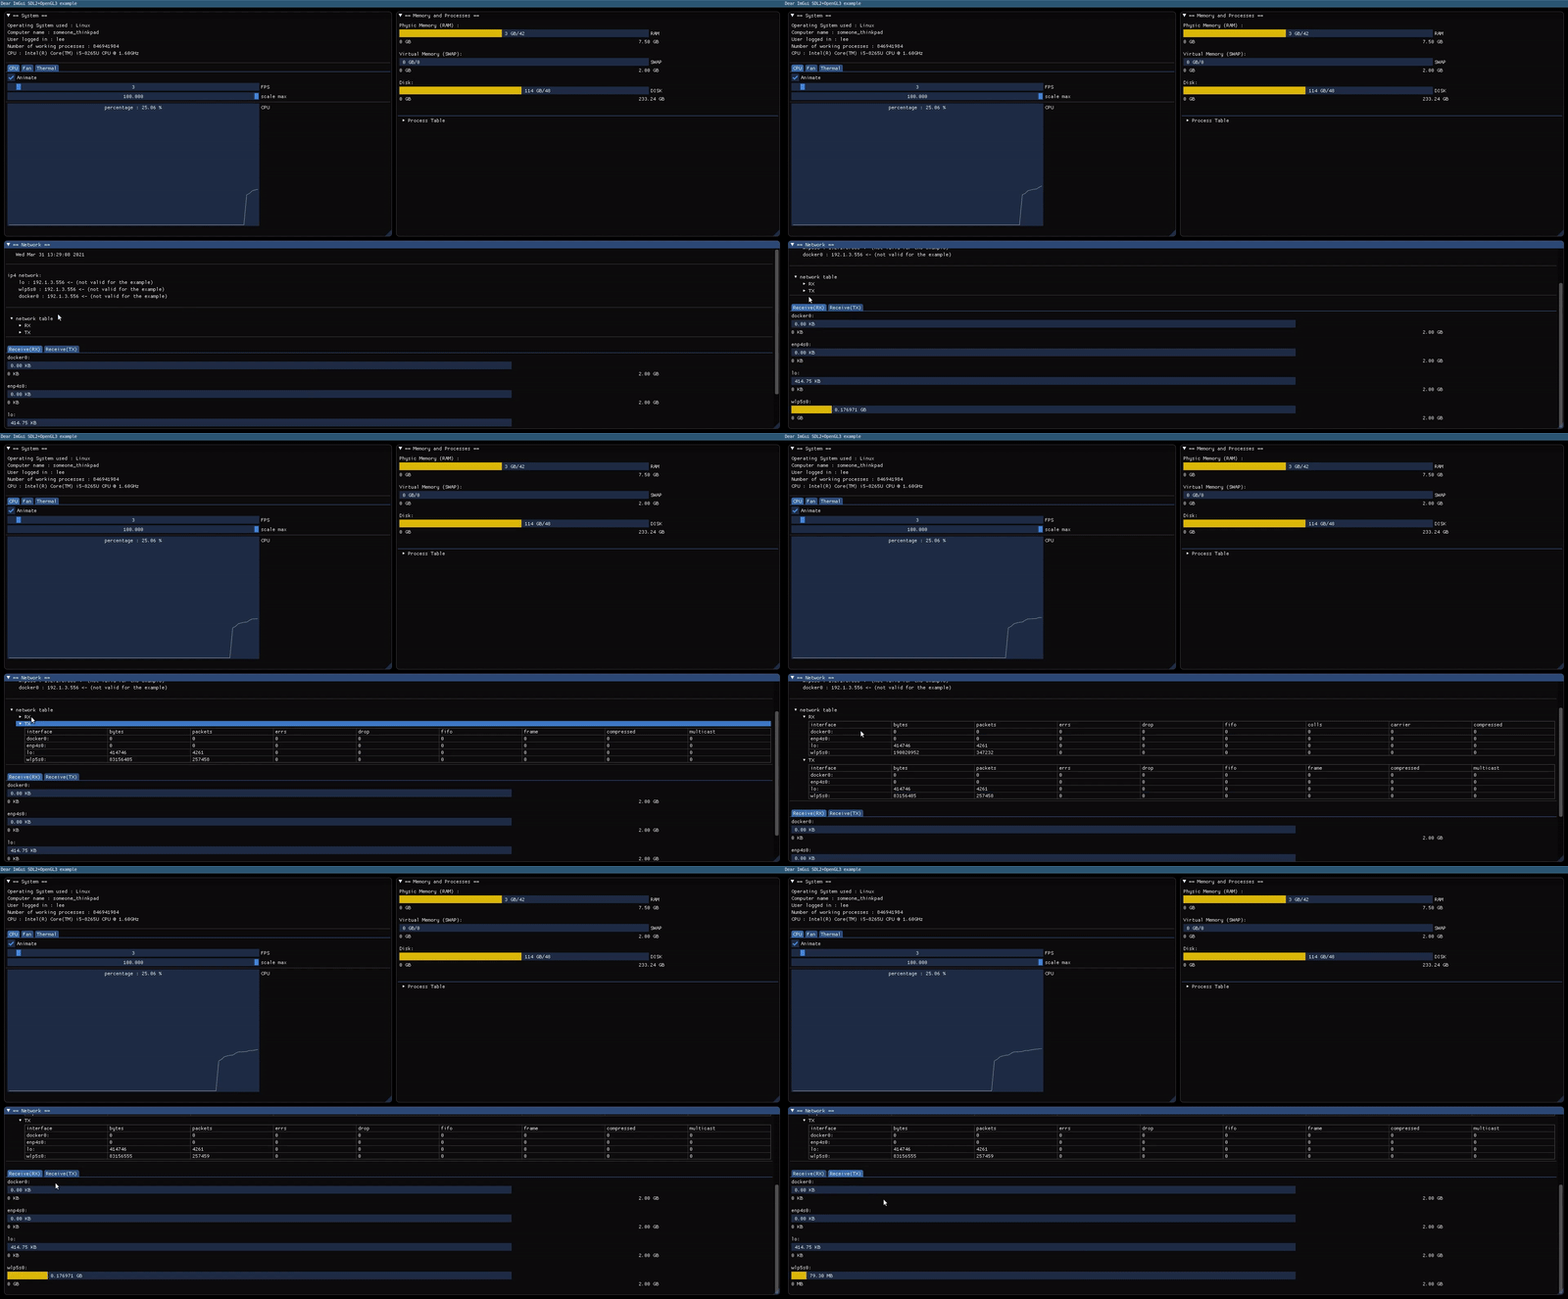
Network, that will contain :
-
The network ipv4, (
lo,wlp5s0and other networks that the computer may have). -
A tab bar that should contain two tables :
RX(network receiver) containing the following data : bytes, packets, errs, drop, fifo, frame, compressed and multicast.TX(network transmitter) containing the following data : bytes, packets, errs, drop, fifo, colls, carrier and compressed.
-
It should also contain a tabbed section for both
RXandTX, those sections should display a visual usage (ex: a progress bar), of all network present on the computer. This visual display should obey the following rules:-
Each network should be converted from bytes to GB, KB or MB depending on the value. It should not display values that are too big or too small. In other words it should be adjustable.
example :
452755738 bytes => 431.78 MB. // perfect
452755738 bytes => 0.42 GB. // too small
452755738 bytes => 442144.28.6 KB. // too big
-
-
The visual display should go from 0GB to 2GB
example :
-
This project will help you learn about:
- C++ programming language
- UI/UX
- Dear ImGui
- CPU
- Memory
- SWAP
- RAM
- Disk
- Network
- Linux filesystem
- proc
- sysfs


