11 KiB
Financial strategies on the SP500
In this project we will apply machine to finance. You are a Quant/Data Scientist and your goal is to create a financial strategy based on a signal outputted by a machine learning model that overperforms the SP500.
The Standard & Poors 500 Index is a collection of stocks intended to reflect the overall return characteristics of the stock market as a whole. The stocks that make up the S&P 500 are selected by market capitalization, liquidity, and industry. Companies to be included in the S&P are selected by the S&P 500 Index Committee, which consists of a group of analysts employed by Standard & Poor's. The S&P 500 Index originally began in 1926 as the "composite index" comprised of only 90 stocks. According to historical records, the average annual return since its inception in 1926 through 2018 is approximately 10%–11%.The average annual return since adopting 500 stocks into the index in 1957 through 2018 is roughly 8%. As a Quant Researcher, you may beat the SP500 one year or few years. The real challenge though is to beat the SP500 consistently over decades. That's what most hedge funds in the world are trying to do.
The project is divided in parts:
- Data processing and feature engineering: Build a dataset: insightful features and the target
- Machine Learning pipeline: Train machine learning models on the dataset, select the best model and generate the machine learning signal.
- Strategy backtesting: Generate a strategy from the Machine Learning model output and backtest the strategy. As a reminder, the idea here is to see what would have performed the strategy if you would have invested.
Deliverables
Do not forget to check the ressources of W1D5 and espcially W1D5E4.
Data processing and features engineering
The first file contains SP500 index data (OHLC: 4 time-series) and the other file contains the OHLCV data on the SP500 contituents.
- Split the data in train and test. The test set should set from 2017 .
- Your first priority is to build a dataset without leakage !!! NO LEAKAGE !!!
Note: Financial data can be complex and tricky to analyse for a lot of reasons. In order to focus on Time Series forecasting, the project gives access to a "simplified" financial dataset. For instance, we consider the composition of the SP500 remains similar over time which is not true and which introduces a "survivor bias". Plus, the data during covid-19 was removed because it may have a significant impact on the backtesting.
"No leakage" intro and small guide: We assume it is day D and we want to take a position on the next h days on the next day. The position starts on day D+1 (included). To decide wether we take a short or long position the return between day D+1 and D+2 is computed and used as a target. Finally, as features on day contain information until day D 11:59pm, target need to be shifted. As a result, the final dataframe schema is:
| Index | Features | Target |
|---|---|---|
| Day D-1 | Features until D-1 23:59pm | return(D, D+1) |
| Day D | Features until D 23:59pm | return(D+1, D+2) |
| Day D+1 | Features until D+1 23:59pm | return(D+2, D+3) |
Note: This table is simplified, the index of your DataFrame is a multi-index with date and ticker.
-
Features: - Bollinger - RSI - MACD Note: you can use any library to compute these features, you don't need to implement all financial features from scratch.
-
Target:
- On day D, the target is: sign(return(D+1, D+2))
Remark: The target used is the return computed on the price and not the price directly. There are statistical reasons for this choice - the price is not stationary. The consequence is that a machine learning model tends to overfit while training on not stationary data.
Machine learning pipeline
- Cross-validation deliverables:
- Implements a cross validation with at least 10 folds. The train set has to be bigger than 2 years history.
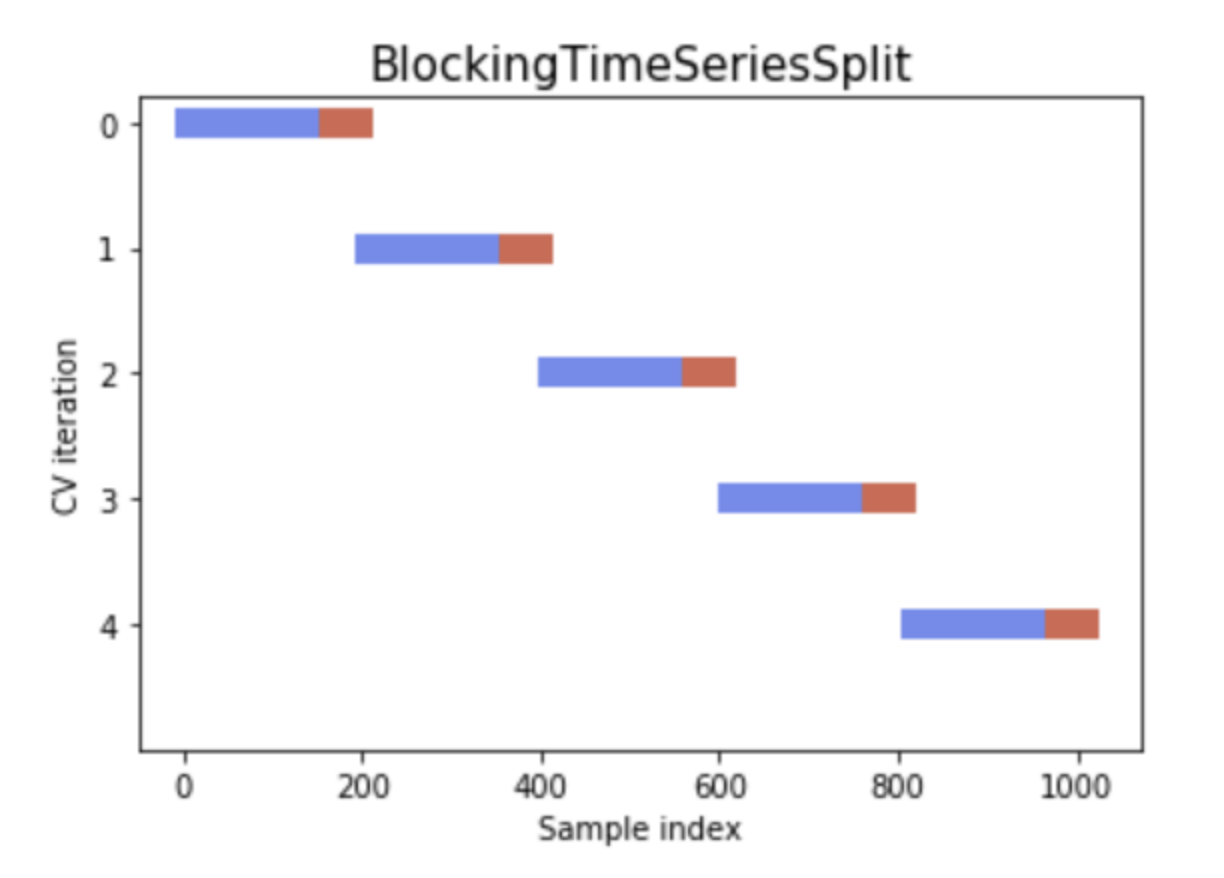
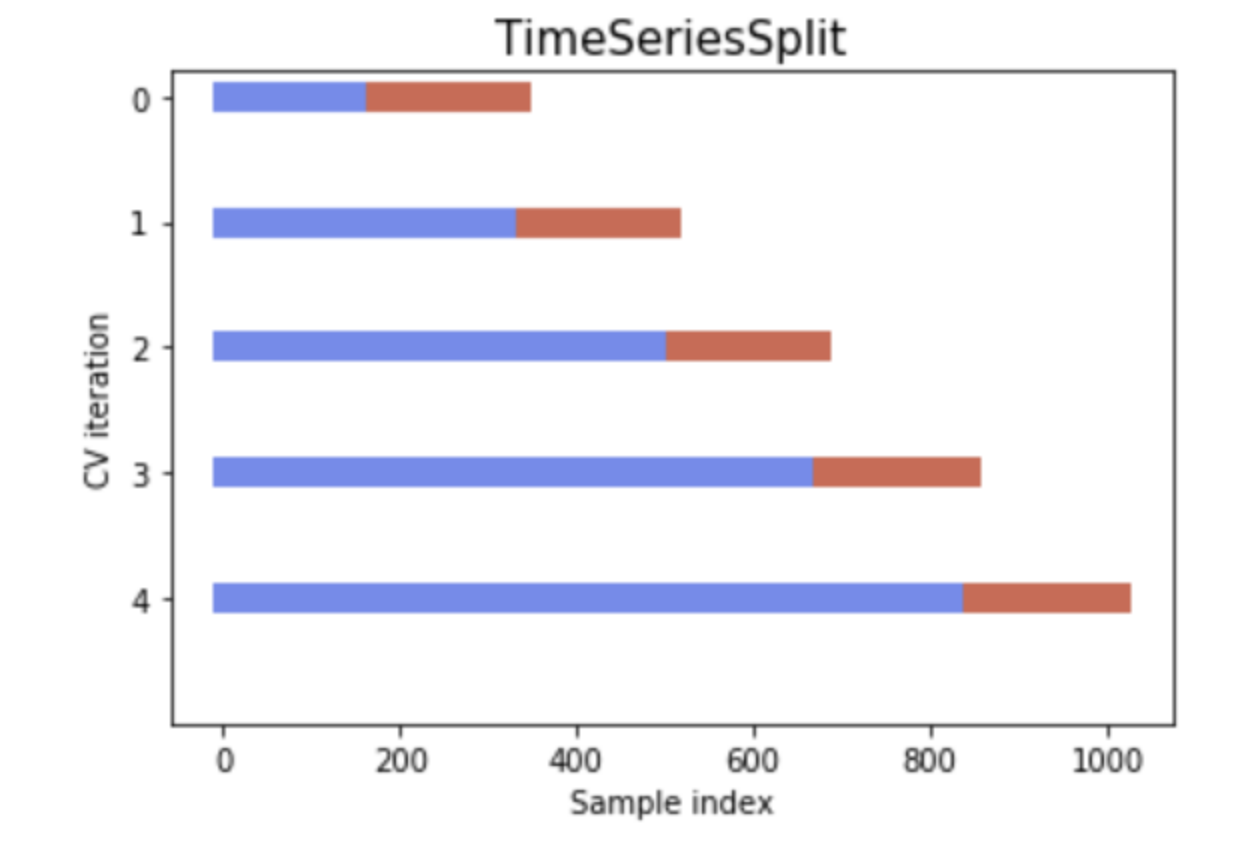
- Two types of temporal cross-validations are required:
- Blocking (plot below)
- Time Series split (plot below)
- Make sure the last fold of the train set does not overlap on the test set.
- Make sure the folds do not contain data from the same day. The data should be split on the dates.
- Plot your cross validation as follow:
Once you'll have run the gridsearch on the cross validation (choose either Blocking or Time Series split), you'll select the best pipeline on the train set and save it as selected_model.pkl and selected_model.txt (pipeline hyper-parameters).
**Note: You may observe that the selected model is not good after analyzing the ml metrics (ON THE TRAIN SET) and select another one. **
- ML metrics and feature importances on the selected pipeline on the train set only.
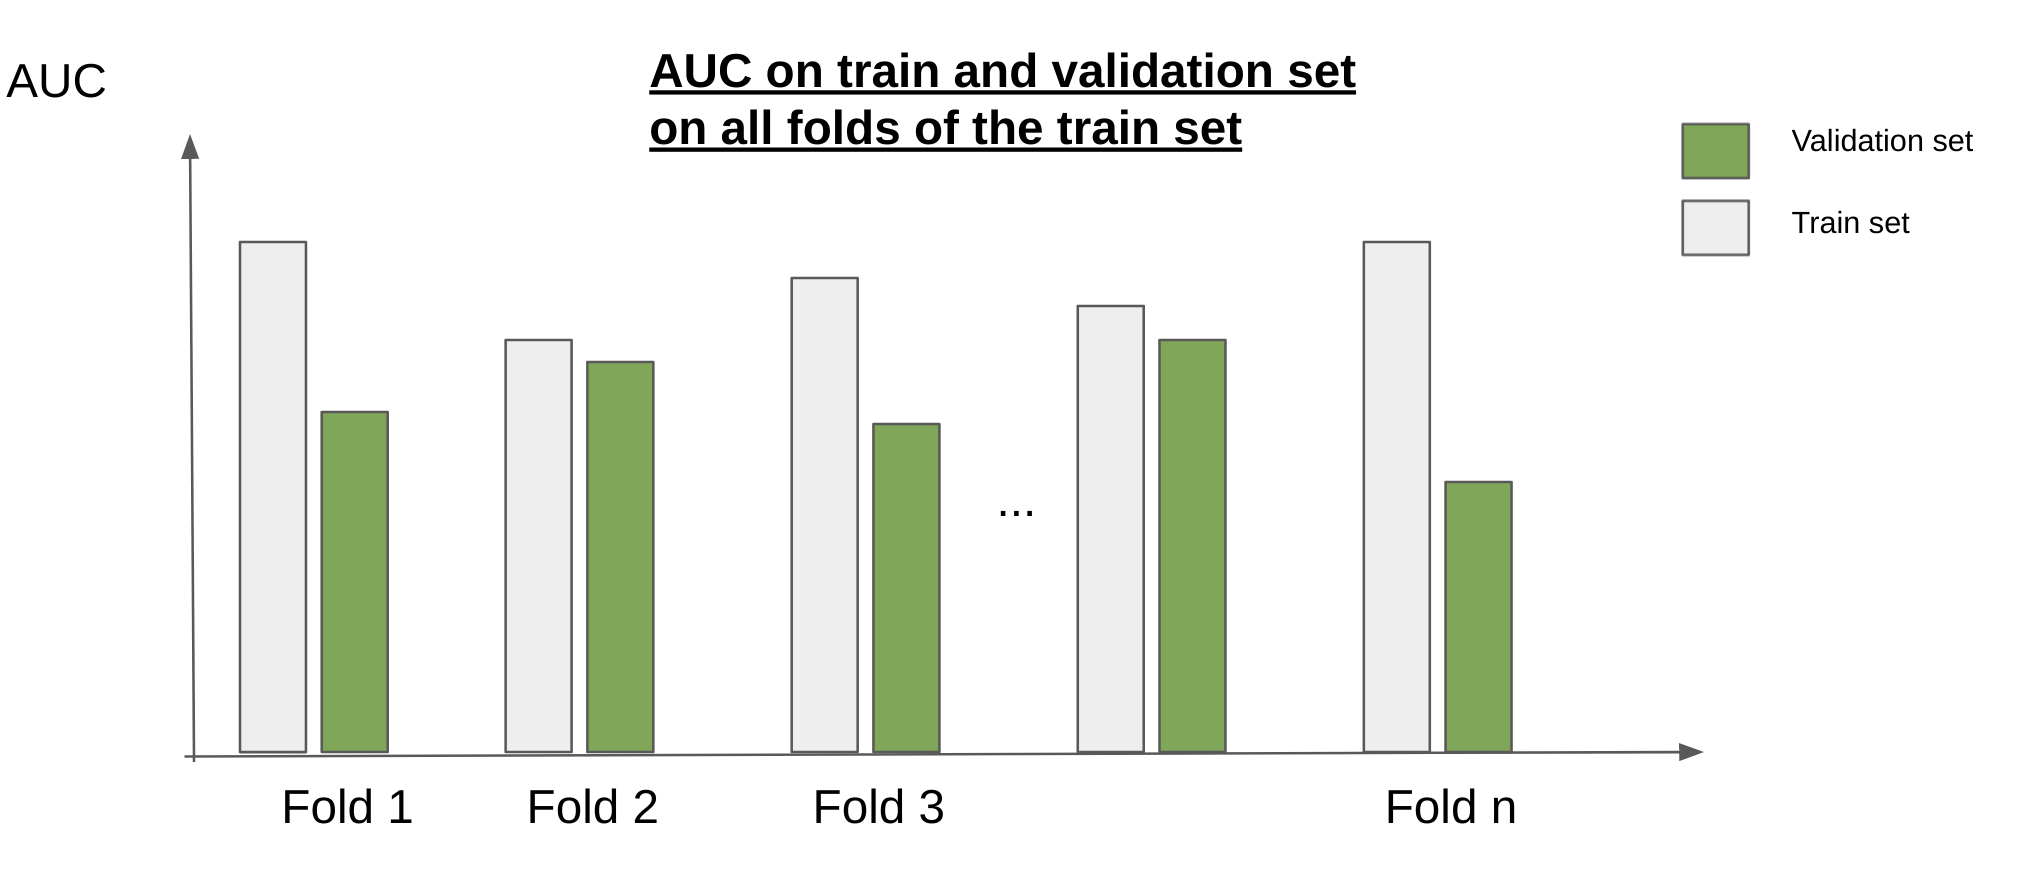
- DataFrame with a Machine learning metrics on train et validation sets on all folds of the train set. Suggested format: columns: ML metrics (AUC, Accuracy, LogLoss), rows: folds, train set and validation set (double index). Save it as
ml_metrics_train.csv - Plot. Choose the metric you want. Suggested: AUC Save it as
metric_train.png. The plot below shows how the plot should look like. - DataFrame with top 10 important features for each fold. Save it as
top_10_feature_importance.csv
- DataFrame with a Machine learning metrics on train et validation sets on all folds of the train set. Suggested format: columns: ML metrics (AUC, Accuracy, LogLoss), rows: folds, train set and validation set (double index). Save it as
- The signal has to be generated with the chosen cross validation: train the model on the train set of the first fold, then predict on its validation set; train the model on the train set of the second fold, then predict on its validation set, etc ... Then, concatenate the predictions on the validation sets to build the machine learning signal. The pipeline shouldn't be trained once and predict on all data points !
The output is a DataFrame or Series with a double index ordered with the probability the stock price for asset i increases between d+1 and d+2.
- (optional): Train a RNN/LSTM. This a nice way to discover and learn about recurrent neural networks. But keep in mind that there are some new neural network architectures that seem to outperform recurrent neural networks: https://towardsdatascience.com/the-fall-of-rnn-lstm-2d1594c74ce0.
Strategy backtesting
- Backtesting module deliverables. The module takes as input a machine learning signal, convert it into a financial strategy. A financial strategy DataFrame gives the amount invested at time t on asset i. The module returns the following metrics on the train set and the test set.
- PnL plot: save it as
strategy.png- x axis: date
- y axis1: PnL of the strategy at time t
- y axis2: PnL of the SP500 at time t
- Use the same scale for y axis1 and y axis2
- add a line that shows the separation between train set and test set
- Pnl
- Max drawdown. https://www.investopedia.com/terms/d/drawdown.asp
- (Optional): add other metrics as sharpe ratio, volatility, etc ...
- Create a markdown report that explains and save it as
report.md:- the features used
- the pipeline used
- imputer
- scaler
- dimension reduction
- model
- the cross-validation used
- length of train sets and validation sets
- cross-validation plot (optional)
- strategy chosen
- description
- PnL plot
- strategy metrics on the train set and test set
- PnL plot: save it as
Example of strategies:
-
Long only:
- Binary signal: 0: do nothing for one day on asset i 1: take a long position on asset i for 1 day
- Weights proportional to the machine learning signals
- invest x on asset i for on day
-
Long and short: For those who search long short strategy on Google, don't get wrong, this has nothing to do with pair trading.
- Binary signal:
- -1: take a short position on asset i for 1 day
- 1: take a long position on asset i for 1 day
- Ternary signal:
- -1: take a short position on asset i for 1 day
- 0: do nothing for one day on asset i
- 1: take a long position on asset i for 1 day
Notes:
-
Warning! When you don't invest on all stock as in the binary signal or the ternary signal, make sure that you are still investing 1$ per day!
-
In order to simplify the short position we consider that this is the opposite of a long position. Example: I take a short one AAPL stock and the price decreases by 20$ on one day. I earn 20$.
- Binary signal:
-
Stock picking: Take a long position on the k best assets (from the machine learning signal) and short the k worst assets regarding the machine learning signal.
Here's an example on how to convert a machine learning signal into a financial strategy:
- Input:
| Date | Ticker | Machine Learning signal |
|---|---|---|
| Day D-1 | AAPL | 0.55 |
| Day D-1 | C | 0.36 |
| Day D | AAPL | 0.59 |
| Day D | C | 0.33 |
| Day D+1 | AAPL | 0.61 |
| Day D+1 | C | 0.33 |
- Convert it into a binary long only strategy:
- Machine learning signal > 0.5
| Date | Ticker | Binary signal |
|---|---|---|
| Day D-1 | AAPL | 1 |
| Day D-1 | C | 0 |
| Day D | AAPL | 1 |
| Day D | C | 0 |
| Day D+1 | AAPL | 1 |
| Day D+1 | C | 0 |
!!! BE CAREFUL !!!THIS IS EXTREMELY IMPORTANT.
-
Multiply it with the associated return.
Don't forget the meaning of the signal on day d: it gives the return between d+1 and d+2. You should multiply the binary signal of day by the return computed between d+1 and d+2. Otherwise it's wrong because you use your signal that gives you information on d+1 and d+2 on the past or present. The strategy is leaked !
Assumption: you have 1$ per day to invest in your strategy.
Project repository structure:
project
│   README.md
│   environment.yml
│
└───data
│   │   sp500.csv
│
└───results
│   │
|   |───cross-validation
│   │   │   ml_metrics_train.csv
│   │   │   metric_train.csv
│   │   │   top_10_feature_importance.csv
│   │   │   metric_train.png
│   │
|   |───selected model
│   │   │   selected_model.pkl
│   │   │   selected_model.txt
│   │   │   ml_signal.csv
│   │
|   |───strategy
|   |   |   strategy.png
│   │   │   results.csv
│   │   │   report.md
|
|───scripts (free format)
│   │   features_engineering.py
│   │   gridsearch.py
│   │   model_selection.py
│   │   create_signal.py
│   │   strategy.py
Note: features_engineering.py can be used in gridsearch.py
Files for this project
You can find the data required for this project in this [link]:(https://assets.01-edu.org/ai-branch/project4/project04-20221031T173034Z-001.zip)


